
Day trading can be both exhilarating and challenging, requiring quick decisions and a solid understanding of market movements. One of the keys to successful day trading is the effective use of technical indicators. Technical indicators are mathematical calculations based on the price, volume, or open interest of a security or contract. By providing traders with insights into market trends and potential reversals, these tools are indispensable for identifying entry and exit points. Here, we explore some of the best technical indicators for day trading, each offering unique perspectives on market dynamics.
1. Moving Averages (MAs)
Moving averages are fundamental to day trading, smoothing out price data to identify the direction of the market trend. Two types are particularly popular among day traders:
- Simple Moving Average (SMA): Calculates the average price of a security over a specific number of periods.
- Exponential Moving Average (EMA): Gives more weight to recent prices, making it more responsive to new information.
Traders often use multiple moving averages (e.g., 50-day and 200-day) on the same chart to identify crossovers, signaling potential market entries or exits.
2. Relative Strength Index (RSI)
The RSI is a momentum oscillator that measures the speed and change of price movements. It oscillates between 0 and 100, typically using a threshold of 70 to identify overbought conditions and 30 for oversold conditions. Day traders use RSI to spot divergences from price movements as a signal for potential reversals.
3. Moving Average Convergence Divergence (MACD)
The MACD is a trend-following momentum indicator that shows the relationship between two moving averages of a security’s price. It consists of the MACD line (difference between the 12-day EMA and the 26-day EMA), the signal line (9-day EMA of the MACD line), and the histogram (difference between the MACD line and the signal line). Crossovers between the MACD line and the signal line can indicate buying or selling opportunities.
4. Bollinger Bands
Bollinger Bands are a volatility indicator. They consist of a middle band (20-day SMA) and two outer bands (standard deviations away from the SMA). This indicator helps day traders understand whether a security is overbought or oversold by analyzing its volatility and price levels relative to the bands. A price move towards the upper band suggests buying pressure, while a move towards the lower band indicates selling pressure.
5. Volume-Weighted Average Price (VWAP)
VWAP is a trading benchmark that gives the average price a security has traded at throughout the day, based on both volume and price. It is particularly useful for day traders to identify if a security is trading higher or lower than the average daytime price. Trading above the VWAP may indicate a bullish trend, while trading below may suggest a bearish trend.
6. Stochastic Oscillator
The Stochastic Oscillator compares a specific closing price of a security to a range of its prices over a certain period. It is used to generate overbought or oversold signals. The indicator moves between 0 and 100, with readings above 80 indicating overbought conditions and readings below 20 indicating oversold conditions. Divergences between the stochastic oscillator and the price trend suggest potential reversal points.
Implementing Technical Indicators in Day Trading
While these indicators are powerful tools, successful day trading requires more than just technical analysis. Consider the following tips:
- Combine Indicators: Use a combination of indicators to confirm trends and signals. Relying on a single indicator may lead to misleading signals.
- Understand Market Conditions: Different indicators work better under different market conditions. Understand whether the market is trending or range-bound and choose your indicators accordingly.
- Practice Risk Management: Always use stop-loss orders and manage your risk exposure. No indicator can predict market movements with 100% accuracy.
- Stay Informed: Keep abreast of market news and events. Technical indicators should be used in conjunction with fundamental analysis for the best results.
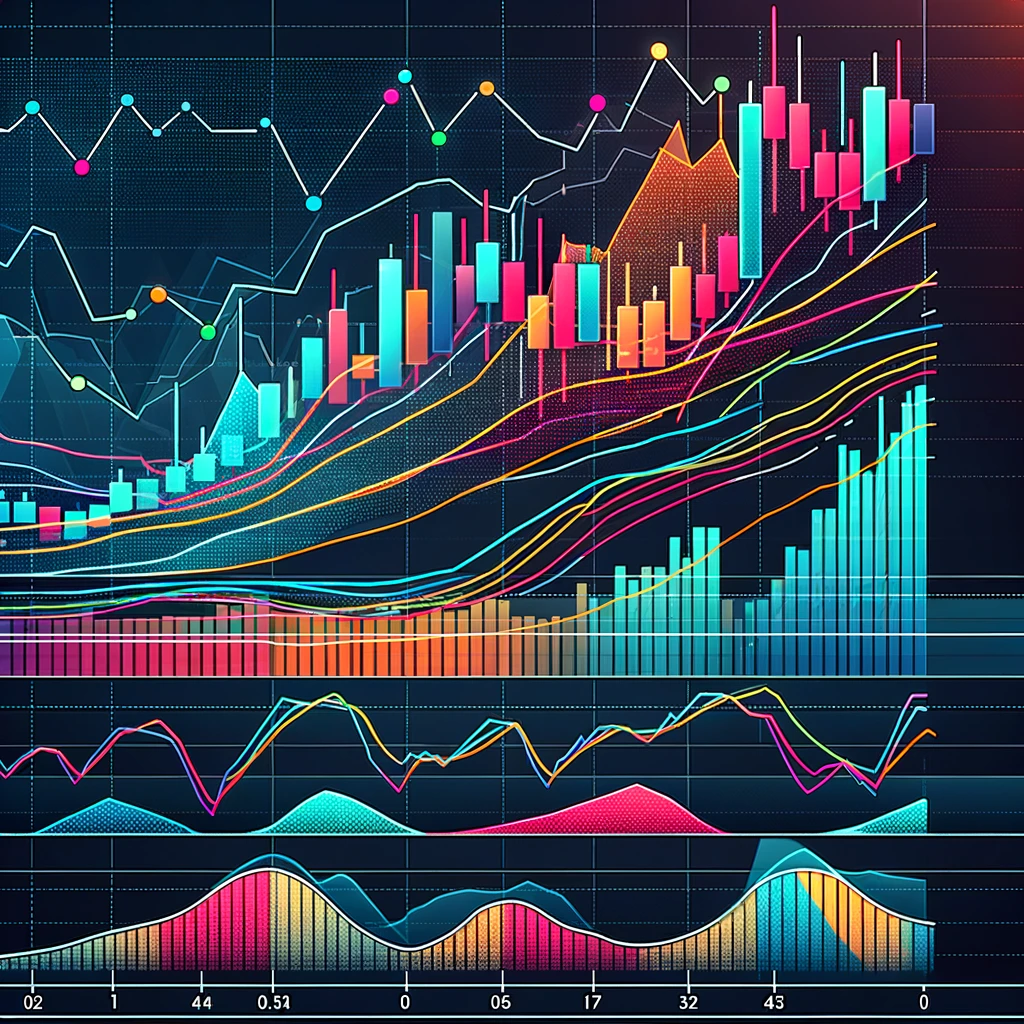
Visualizing Market Trends: An Illustrative Chart
To help visualize how these indicators work in practice, let’s consider an illustrative chart incorporating some of the best technical indicators for day trading, including Moving Averages, RSI, and MACD.
Conclusion
The best technical indicators for day trading offer insights into market momentum, trends, and potential reversals. However, it’s crucial to remember that no indicator is infallible. Successful day trading requires a combination of technical analysis, fundamental insights, and disciplined risk management. By understanding and applying these indicators effectively, traders can enhance their ability to make informed decisions in the fast-paced world of day trading.
Further Reading and Resources
For
those looking to dive deeper into technical indicators and day trading strategies, consider exploring the following resources:
- Investopedia: A comprehensive resource for financial terms and concepts, including detailed articles on technical indicators.
- TradingView: Offers real-time charts and a community of traders sharing insights and strategies.
- Babypips: A great resource for beginners, offering easy-to-understand guides on forex trading and technical analysis.
These resources provide valuable information for traders at all levels, from novice to advanced, looking to refine their day trading techniques and understanding of the market.
This article offers a foundational overview of the best technical indicators for day trading, emphasizing the importance of a holistic trading strategy that combines technical analysis with fundamental insights and sound risk management.