I came across this price action pattern today that I’ve seen before. I thought it may be worth documenting for the future.
I have noticed that there are times when a strong bullish trend is presented when there is a smaller slow down candle. Then, shortly thereafter, a relatively stronger bullish candle. There have been times where I took this to mean the trend was about to accelerate, again, only to see things reverse – or, at least, stagnate.
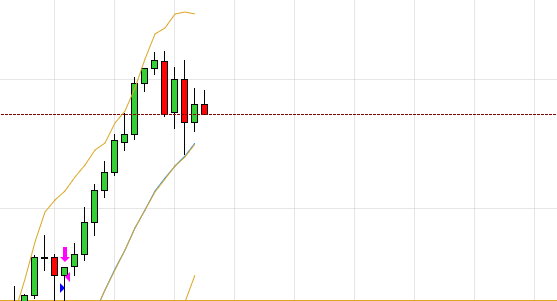
I saw this setup today and experience told me that the trend was at its end and that was the result. Here is a screen shot of that action… You can see the larger bullish bar about 8 bars from the end. Not sure where I’d put a sell order. If I was being aggressive, probably just below the top of the bullish signal bar?

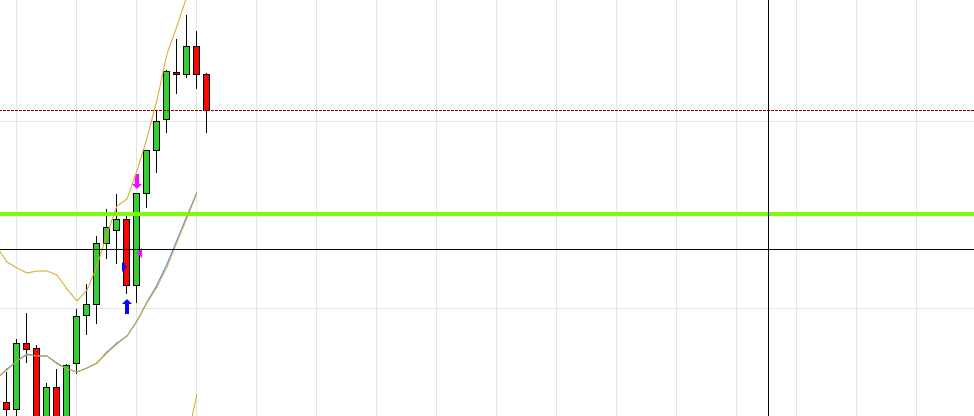
Here’s another two examples just a few minutes later.

Starting from the left, there is a run of six bull bars. the third bar is small followed by a relatively larger bull bar. Then two smaller bars and a large bear bar. Shortly after that – just before the top, you see a larger bull followed by a doji and a smaller bull .
In both cases, a short order at the top of the signal bar would have yielded a nice scalp.
